

Disparate impact: Why are European equities underperforming?
It has been taken as given that the Iran war has been economically worse for Europe than for the US, as the former is an energy importer while the latter is an exporter.
From a GDP point of view, this is certainly the case. Net exports should improve for the US and deteriorate for Europe.
But the effect on business activity and consumer demand is not necessarily different. It does not matter to a business or an individual whether the now more expensive energy was imported or produced domestically.
The price increase for Brent oil (the benchmark for Europe) has indeed been greater than that for West Texas Intermediate (the US benchmark), but not dramatically so. The Brent ‘premium’ - how much Brent oil prices have increased compared to WTI - has averaged just 7% over the last two months, though for a few days it topped 20% (see Exhibit 1).
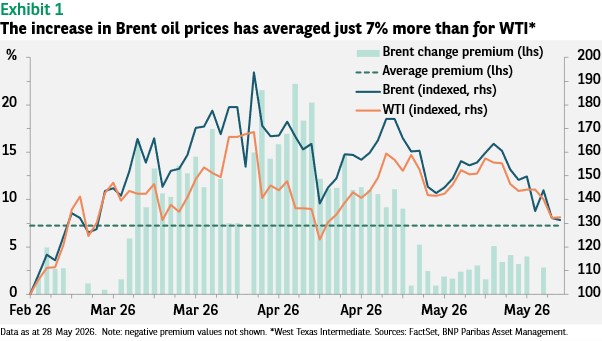
However, this premium does not seem to be sufficient to cause a significantly greater weakening of the European economy. In fact, one could argue the impact of higher energy prices could be greater on the US.
The average US motorist drives around twice the number of kilometres per year than a European driver.1 In addition, transportation costs represent a higher share of service sector costs in the US than in Europe, due to the greater physical size of the market. On the other hand, manufacturing represents a larger share of the economy (15%) in Europe than it does in the US (10%).
Regardless of what one might believe should be the impact, Purchasing Managers’ Indices show that the European economy is weakening more than the US.
While some manufacturing sector PMIs somewhat surprisingly improved in March and April (partly due to higher supplier delivery times, which is interpreted as positive in the index calculation as it may indicate high demand), the flash figures for May dropped into contractionary territory for Germany and France, while the PMI improved in the US (see Exhibit 2).
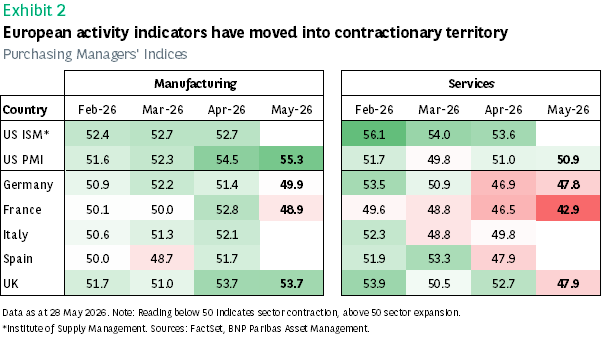
The services sector’s deterioration was immediate and more dramatic, though the impact of higher energy prices on services should be less than for manufacturing.
European PMIs have fallen an average of five points and all the readings are below 50, indicating contraction. In the US, there has been a deterioration of less than two points and the PMIs remain in expansionary territory.
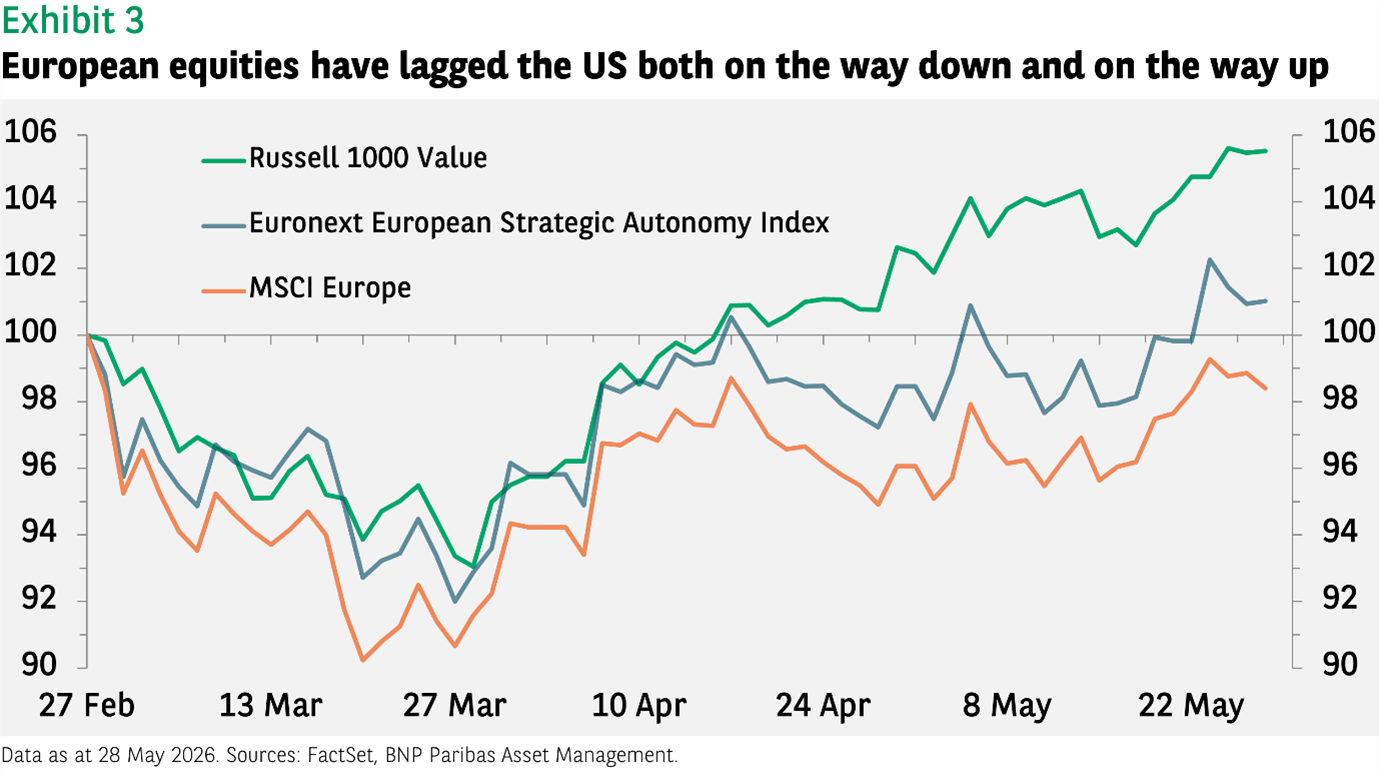
The final arbiter as far as equity investors are concerned is the market itself - and it has delivered a similar judgement. Since 27 February, European equities have underperformed US value stocks, using the Russell 1000 Value index instead of the S&P 500 to measure the performance of the US market in order to make an ‘apples to apples’ comparison as far as sector composition is concerned.
The S&P 500 has outperformed the Russell index, but this reflects the recent global outperformance of technology shares, which make up only a small part of the MSCI Europe index.
Despite the recovery in equity markets since the end of March, the MSCI Europe’s return since the start of the war is still negative while the Russell Value is more than 5% higher (see Exhibit 3).
- {https://frontiergroup.org/resources/fact-file-americans-drive-most/ Frontier Group, February 2022}
European equities’ underperformance is nothing new - but blaming it on the Iran war may be a mistake. The structural challenges the region faces, and the arguably greater dynamism of US companies, is a more likely explanation.
A better option for investors looking for exposure to the region may be to focus on industries which will potentially benefit from initiatives to support Europe’s sovereign ambitions - to protect its interests without relying on other states.
This approach addresses deficiencies in the defence sector but also looks to boost capabilities in healthcare and energy resilience, for example.
The potential investment opportunity is clear as investors can effectively monetise government spending as funding from policies to support this goal goes primarily to companies. The offsetting factor may be higher government bond yields if debt turns out to be the primary source of the additional funding.
Performance data sources: FactSet, BNP Paribas Asset Management as of 28 May 2026 (unless otherwise stated). Past performance should not be seen as a guide to future returns.


Disclaimer
BNP Paribas Group's acquisition of AXA Investment Managers was completed on 1 July 2025, and AXA Investment Managers is now part of BNP Paribas Group.
This website is published by AXA Investment Managers Asia (Singapore) Ltd. (Registration No. 199001714W) for general circulation and informational purposes only. It does not constitute investment research or financial analysis relating to transactions in financial instruments, nor does it constitute on the part of BNP Paribas Asset Management or its affiliated companies an offer to buy or sell any investments, products or services, and should not be considered as solicitation or investment, legal or tax advice, a recommendation for an investment strategy or a personalized recommendation to buy or sell securities. It has been prepared without taking into account the specific personal circumstances, investment objectives, financial situation or particular needs of any particular person and may be subject to change without notice. Please consult your financial or other professional advisers before making any investment decision.
Due to its simplification, this publication is partial and opinions, estimates and forecasts herein are subjective and subject to change without notice. There is no guarantee forecasts made will come to pass. Data, figures, declarations, analysis, predictions and other information in this publication is provided based on our state of knowledge at the time of creation of this publication. Whilst every care is taken, no representation or warranty (including liability towards third parties), express or implied, is made as to the accuracy, reliability or completeness of the information contained herein. Reliance upon information in this material is at the sole discretion of the recipient. This material does not contain sufficient information to support an investment decision.
All investment involves risk, including the loss of capital. The value of investments and the income from them can fluctuate and investors may not get back the amount originally invested. Past performance is not necessarily indicative of future performance.
Some of the Services and/or products may not be available for offer to retail investors.
This publication has not been reviewed by the Monetary Authority of Singapore.